Data Visualizations & Analysis
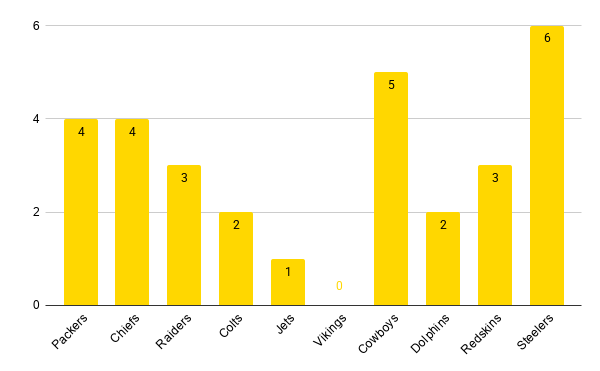
Chart 1: Win Efficiency (Games Played vs. Wins)
Analysis & Insight: This bar chart compares the total Super Bowl appearances (GP) against the actual wins (W) for top franchises. It effectively highlights efficiency. For example, while the Cowboys and Steelers both have 8 appearances, the Steelers have a higher conversion rate with 6 wins compared to the Cowboys' 5. Meanwhile, the Packers demonstrate exceptional efficiency, winning 4 out of their 5 appearances (an 80% win rate).
Chart 2: Offensive vs. Defensive Dominance (PPG vs OPP PPG)
Analysis & Insight: This dual-bar chart compares a team's average points per game (PPG) against what they allow their opponents to score (OPP PPG). This visualization creates a powerful narrative about balance. The Packers show massive offensive dominance (31.6 PPG) outscoring opponents easily. Conversely, the Vikings reveal why they have 0 wins in 4 appearances: their offensive PPG is an abysmal 8.5, while giving up 23.8 points defensively.
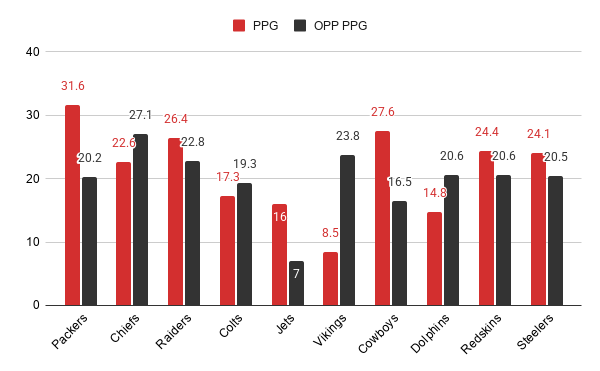
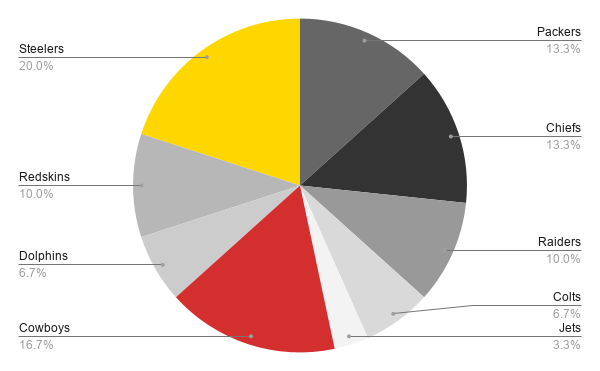
Chart 3: Championship Monopoly (Distribution of Total Wins)
Analysis & Insight: This pie chart visualizes the distribution of total Super Bowl wins among these top 10 listed teams. It is highly effective in showing how "top-heavy" NFL history is. The Steelers (6 wins) and Cowboys (5 wins) take up a massive slice of the championship pie. This visual argument proves that a significant portion of Super Bowl victories are monopolized by a very small group of legacy franchises rather than being evenly distributed across the league.